Next: Multi-MA extension Up: DIET dashboard Previous: LogService Contents
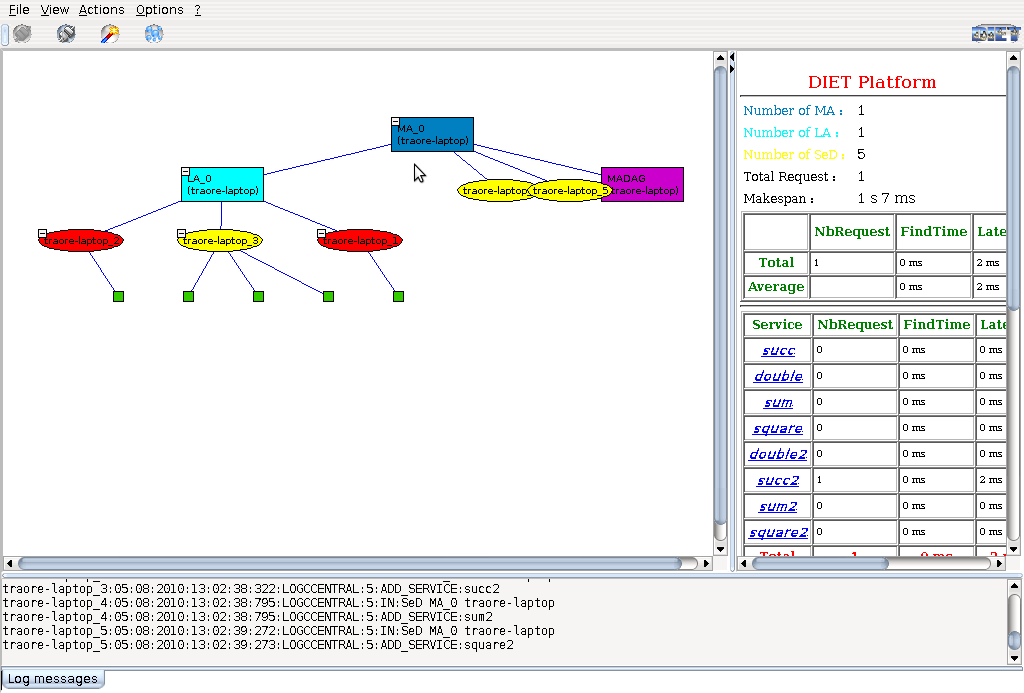
VizDIET provides a graphic representation of the DIET architecture being monitored. There are two ways to use VizDIET.
As described in Section 1.4, there are two main steps in the
treatment of a request in DIET: one step to find and schedule a service, and
one step to solve this service. So two main activities are represented:
schedule and compute information
FindRequests are only attached to agents and SolveRequests are only attached to SeDs. Finally the aggregation of one FindRequest and its SolveRequest is concatenated in one request: DIETRequest. DIETResquest can be see as a job execution in a DIET platform as seen by an end-user. A DIETRequest is also associated with a latency, which is time between the end of a FindRequest and the beginning of a SolveRequest.
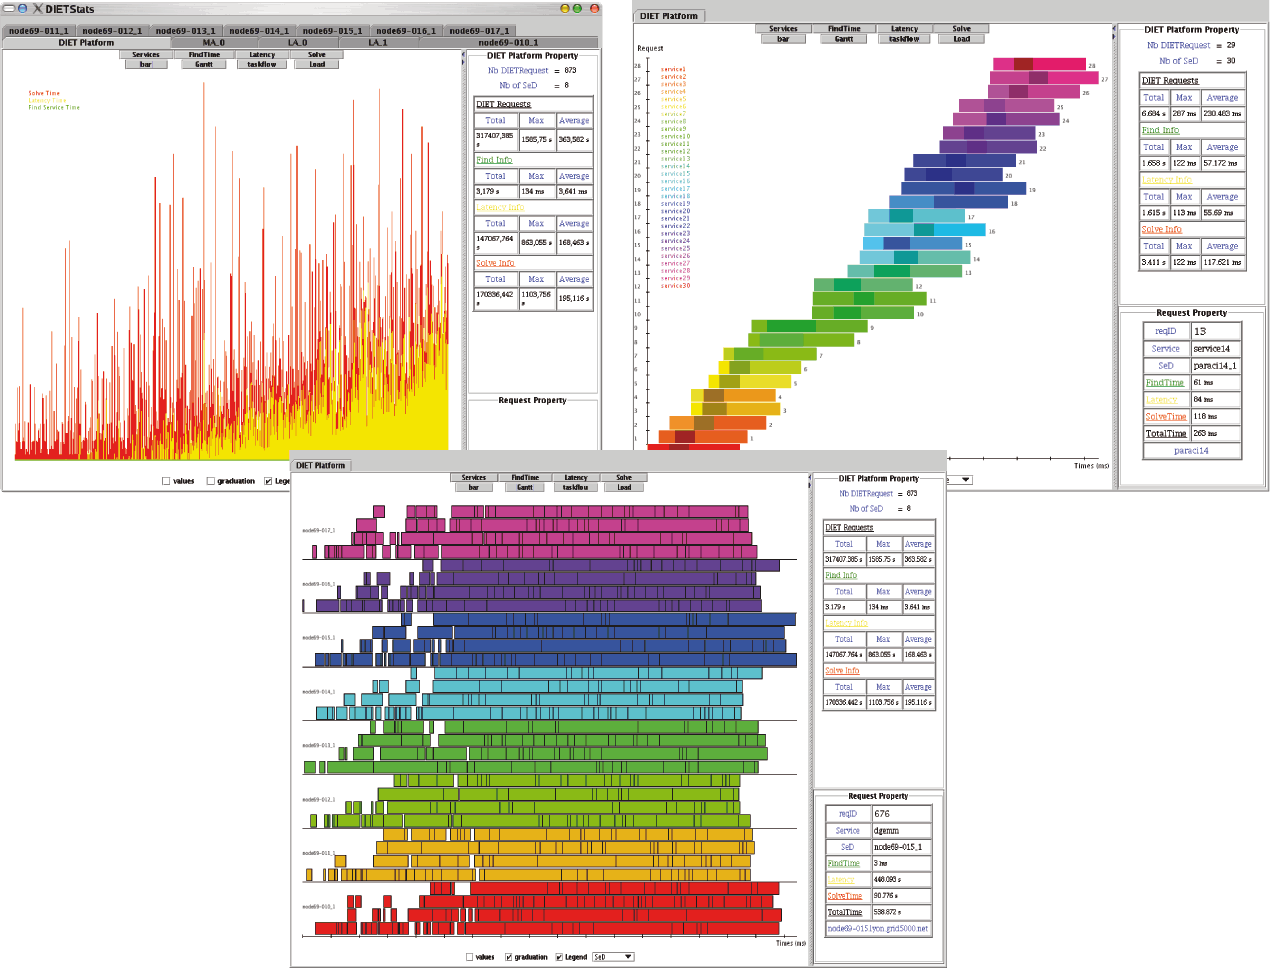
VizDIET offers the possiblity to visualize all of these requests from either the point of view of the DIET platform, in which case you will see the DIETRequests, or in the point of view of the Agents or SeDs, in which case you will see respectively the FindRequest and the SolveRequest. The different kinds of requests are represented in different types of graphics such as a Gantt chart, taskflow chart, or bar chart.
VizDIET also computes some other statistics for the platform such as average time for scheduling, for solving, or latency. This information can be see for the whole service in the platform or for one specific service. VizDIET has one other interesting feature: the possibility to export all data collected by VizDIET into a file using a format that you specify.
Finally, VizDIET is quite useful for understanding the behavior of the DIET hierarchy and quite simple to use. You have to keep in mind that VizDIET bases its information upon log information that is forwarded by LogCentral from DIET components. Therefore, the information displayed and computed in VizDIET is limited to the DIET hierarchy (e.g., there is no information about clients).
Future development of VizDIET will depend on new developments in DIET. For example, a new integration between DIET and JuxMem allows DIET to store data in the JuxMem service. Correspondingly, the capability to log and visualize these transfers has been added to VizDIET. VizDIET is available for download. See the web page http://graal.ens-lyon.fr/DIET/vizdiet.html for more information.
The DIET Team - Mer 29 nov 2017 15:13:36 EST