CoRI architecture
The scheduler requires performance measurement tools to make effective scheduling decisions. Thus, DIET depends on reliable grid resource information services. In this section we introduce the exact requirements of DIET for a grid information service, the architecture of the new tool CoRI (Collectors of Resource Information) and the different components inside of CoRI.
In this page, we describe the design of CoRI, this new platform performance subsystem that we have implemented to enable future versions of the DIET framework to more easily interface with third-party performance monitoring and prediction tools. Our goal is to facilitate the rapid incorporation of such facilities as they emerge and become widely available. This issue is especially pertinent, considering the fact that DIET is designed to run on heterogeneous platforms, on which many promising but immature tools may not be universally available. Such a scenario is common, considering that many such efforts are essentially research prototypes. To account for such cases, we have designed the performance evaluation subsystem in DIET to be able to function even in the face of varying levels of information in the system.
We designed CoRI to ensure that it (i) provides timely performance information in order to avoid impeding the scheduling process and (ii) presents a general-purpose interface capable of encapsulating a wide range of resource information services. Firstly, it must provide basic measurements that are available regardless of the state of the system. The service developer can rely on such information even if no other resource performance prediction service like FAST (described in following) (Fast Agent’s System Timer) or NWS is installed. Secondly, the tool must manage the simultaneous use of different performance prediction systems within a single heterogeneous platform. To address these two fundamental challenges, we offer two solutions: the CoRI-Easy collector to universally provide basic performance information, and the CoRI Manager to mediate the interactions among different collectors. In general, we refer collectively to both these solutions as the CoRI tool, which stands for Collectors of Resource Information. Both subsystems are described in the following section.
Broadly, the CoRI-Easy facility is a set of simple requests for basic resource information, and the CoRI Manager is the tool that enables application developers to add access methods to other resource information services. As CoRI-Easy is fundamentally just a resource information service, we implement it as a collector that is managed by the new CoRI Manager. Note that CoRI-Easy is not the only collector available; for example, FAST can be used as well. Moreover, adding new collectors is a simple matter of implementing a thin interface layer that adapts the performance prediction data output to the reporting API that the CoRI Manager expects.
CoRI Manager
The CoRI Manager provides access to different collectors, which are software components that can provide information about the system. This modular design decouples the choice of measurement facilities and the utilization of such information in the scheduling process. Even if the manager should aggregate across performance data originating from different resource information services, the raw trace of data remains, and so its origin can be determined. For example, it could be important to distinguish the data coming from the CoRI-Easy collector and the FAST collector, because the performance prediction approach that FAST uses is more highly tuned to the features of the targeted application. Furthermore, the modular design of the CoRI Manager also permits a great deal of extensibility, in that additional collectors based on systems such as Ganglia or NWS can be rapidly implemented via relatively thin software interface layers. This capability enables DIET users to more easily evaluate prototype measurement systems even before they reach full production quality.
Technical overview of CoRI
Now, we describe in greater detail the structure of the estimation_vector. We then enumerate the standard metrics of performance used in DIET and present the various CoRI Manager functions. The vector is divided into two parts. The first part represents « native » performance measures that are available through CoRI (e.g.,~the number of CPUs, the memory usage, etc.) and the scheduling subsystem (e.g.,~the time elapsed since a server’s last service invocation). The second part is reserved for developer-defined measurements that are meaningful solely in the context of the application being developed. The vector supports the storage of single and multiple values, because some performance prediction measurements are not only single values (called scalars) but a list of values (e.g.,~the load on each processor of a multi-processor node). An estimation vector is essentially a container for a complete performance snapshot of a server node in the DIET system, composed of multiple scalars and lists of performance data.
To differentiate among the various classes of information that may be stored in an estimation vector, a data tag is associated with each scalar value or list of related values. This tag enables DIET’s performance evaluation subsystems to identify and extract performance data. There are two types of tags: system tags and user-defined tags. System tags correspond to application-independent data that are stored and managed by the CoRI Manager; Table 1 enumerates the set of tags that are supported in the current DIET architecture.
| Information tag starts with EST_ | multi-value | Description |
|---|---|---|
| TCOMP | the predicted time to solve a problem | |
| TIMESINCELASTSOLVE | time since last solve has been made (sec) | |
| FREECPU | amount of free CPU between 0 and 1 | |
| LOADAVG | CPU load average | |
| FREEMEM | amount of free memory (Mb) | |
| NBCPU | number of available processors | |
| CPUSPEED | x | frequency of CPUs (MHz) |
| TOTALMEM | total memory size (Mb) | |
| BOGOMIPS | x | the BogoMips |
| CACHECPU | x | cache size CPUs (Kb) |
| TOTALSIZEDISK | size of the partition (Mb) | |
| FREESIZEDISK | amount of free place on partition (Mb) | |
| DISKACCESREAD | average time to read from disk (Mb/sec) | |
| DISKACCESWRITE | average time to write to disk (Mb/sec) | |
| ALLINFOS | x | [empty] fill all possible fields |
User-defined tags represent application-specific data that are generated by specialized performance estimation routines that are defined at compile-time for the SeD. Note also that the EST_ALLINFOS tag is in fact a pseudo-tag that is simply used to express a request for all performance information that is available from a particular collector. At the moment of service registration, a SeD also declares a priority list of comparison operations based on these data that logically expresses the desired performance optimization semantics. The mechanisms for declaring such an optimization routine is outside the scope of this paper; for a fully detailed description of the API, please consult the DIET manual.
The basic public interface of the CoRI Manager that is available to DIET service developers (and implicitly to DIET developer as well) consists of three functions. The first function allows the initialization of a given collector and adds the collector to the set of collectors that are under the control of the CoRI Manager. The second function provide access to measurements. The last function tests the availability of the CoRI-Easy collector.
CoRI-Easy collector
The CoRI-Easy collector is a resource collector that provides basic performance measurements of the SeD. Via the interface with the CoRI Manager, the service developer and the DIET developer are able to access CoRI-Easy metrics. We first introduce the basic design of CoRI-Easy, and then we will discuss some specific problems. CoRI-Easy should be extensible like CoRI Manager, i.e.~the measurement functions must be easily replaceable or extended by new functionality as needed.
Consequently, we use a functional approach: functions are categorized by the information they provide. Each logical type of performance information is identified by an information class, which enables users to simply test for the existence of a function providing a desired class of information. Thus, it is even possible to query the CoRI-Easy collector for information about the platform that may not yet have been realized. Our goal was not to create another sensor system or monitor service; CoRI-Easy is a set of basic system calls for providing basic performance metrics. Note that the data measured by CoRI-Easy are available via the interface of the CoRI Manger.
- CPU evaluation
- CoRI-Easy provides CPU information about the node that it monitors: the number of CPUs, the CPU frequency and the CPU cache size. These static measurements do not provide a reliable indication of the actual load of CPUs, so we also measure the node’s BogoMips (a normalized indicator of the CPU power), the load average and CPU utilization for indicating the CPU load.
- Memory capacity
- The memory is the second important factor that influences performance. CoRI monitors the total memory size and the available memory size.
- Disk Performance and capacity
- CoRI-Easy also measures the read and write performance of any storage device available to the node, as well the maximal capacity and the free capacity of any such device.
- Network performance
- CoRI-Easy should monitor the performance of interconnection networks that are used to reach other nodes, especially those in the DIET hierarchy to which that node belongs; this functionality is planned for a future release.
FAST collector
FAST was the first collector of DIET. This project is closed now. FAST (Fast Agent System Timers) is a tool for dynamic performance forecasting in a Grid environment. FAST is composed of several layers and relies on low level software. First, it uses a network and CPU monitoring software to handle dynamically changing resources, like workload or bandwidth. FAST uses the Network Weather Service (NWS), a distributed system that periodically monitors and dynamically forecasts the performance of various network and computational resources. The dynamic data acquisition module of FAST uses and enhances NWS. FAST also includes routines to model the time and space needs for each triplet (problem ; machine ; parameters set ). They are based on benchmarking at installation time on each machine for a representative set of parameters and polynomial data fitting. To store these static data, FAST uses the same LDAP-tree.
FAST is build upon several components:
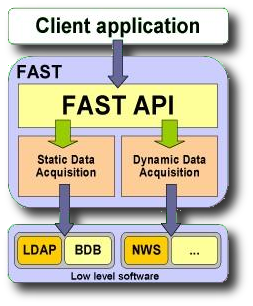
FAST Architecture
- NWS
- LDAP
- …